
I’ve gotten a handful of questions recently about what’s really going on with the US 5G rollout, so I decided that it would be worth inserting this post into the publication schedule as a sort of addendum to the post we wrote awhile back on the broader topic of 5G. If you haven’t previously read The 5G Miracle Cure, I highly recommend that you pause, and give that a perusal, because I’ll be assuming for this post that you are already conversant with the technical details covered therein.
In case you haven’t been following the barrage of news articles that don’t actually have very much to say, here is the situation underlying this post. In the US, the electromagnetic spectrum is licensed by the Federal Communications Commission (FCC). Certain frequencies are typically reserved for certain uses and parties – for instance, most of the X-Band has traditionally been reserved for military use in the US (although this has started to change somewhat) – who pay licensing fees to the FCC for their portion of the spectrum. In 2021, after a lengthy negotiation process, careful study, and an enormous licensing fee (I believe I read on the order of $80 billion), the FCC awarded a portion of the C-band to a handful of commercial carriers for use in 5G networks. As the time for the actual rollout approached, however, the FAA (which had been involved in the original negotiations and approved the original plan), threatened to cancel flights, warning of potential interference with aircraft intrumentation.
Whether because journalists seem to generally exhibit somewhat poor technical understanding of the concepts they cover (there are certainly exceptions, but I read a lot of news articles, and this is my broad opinion), or because they’re deliberately trying to spin some kind of narrative, the coverage of this issue has been less than enlightening, leading me to receive many questions like “why can’t we test for this instrument interference,” “why was this approved in the first place if it’s a problem,” and “how is this likely to be resolved?” While I can’t answer that last one, I will attempt to provide some insight on the first two.
Disclaimer: while The 5G Miracle Cure was primarily informative, with minimal interference from my personal opinions, the following content will absolutely be my personal opinion. I’d like to think that it is a well-informed, well-researched, and well-thought-out opinion, but I also understand that you might not be coming to a publishing website to hear some author talk about the politics of the electromagnetic spectrum, so I like to throw out these disclaimers. Now, without further ado…
There is a very simple answer to the first question: it was tested for, quite thoroughly and extensively, and the results were included in an FCC report on the subject preceding the licensing agreement. Based on the findings, a buffer zone between the frequencies utilized for air travel purposes and those to be allocated to 5G carriers was established, which at the time the FAA seems to have deemed adequate. The follow-up question – why did they change their minds – is where this really becomes my own opinion on the situation.
Fact: the electromagnetic spectrum is a limited natural resource, just like land, minerals, and everything else. Also more or less fact (it’s not physics, so I can’t really just call it a fact): the FAA perceives its reputation to have been tarnished by Boeing 737 MAX and other incidents in recent history. Opinion: Combining these two factors, the FAA’s change of heart is the result of a turn to hyper-conservative (in the non-political sense) decision making resulting from its perception of its reputation, and realpolitik considerations of immensly valuable lost electromagnetic turf.
It probably helps that this is being primarily framed as the FAA putting safety first while commercial companies attempt to push recklessly forward with a new technology rollout, which means that the FAA’s reputation continually benefits, and it is highly unlikely that the companies involved will decide not to acquiese to further demands for delays. It’s an image thing. Although, you could also frame this is a standoff between the FAA and the FCC, but the cynical side of me says that such a narrative doesn’t gain as many clicks.
So, how much merit do the FAA’s concerns about interference have, if a buffer zone is already provided? By the way, you can find the original agreement with all of the details from the FCC by following this link, which will download the PDF to your computer: FCC-20-22a1. Well, it’s time to dive into some technical detail. With some quick research, I was able to find some of the currently allocated frequency bands for 5G. Here’s a table:
Frequency Range 1
| Band | Duplex mode | ƒ (MHz) | Common name | Subset of band | Uplink (MHz) | Downlink (MHz) | Duplex spacing (MHz) | Channel bandwidths (MHz) |
|---|---|---|---|---|---|---|---|---|
| n1 | FDD | 2100 | IMT | n65 | 1920 – 1980 | 2110 – 2170 | 190 | 5, 10, 15, 20 |
| n2 | FDD | 1900 | PCS | n25 | 1850 – 1910 | 1930 – 1990 | 80 | 5, 10, 15, 20 |
| n3 | FDD | 1800 | DCS | 1710 – 1785 | 1805 – 1880 | 95 | 5, 10, 15, 20, 25, 30 | |
| n5 | FDD | 850 | CLR | 824 – 849 | 869 – 894 | 45 | 5, 10, 15, 20 | |
| n7 | FDD | 2600 | IMT‑E | 2500 – 2570 | 2620 – 2690 | 120 | 5, 10, 15, 20, 25, 30, 40, 50 | |
| n8 | FDD | 900 | Extended GSM | 880 – 915 | 925 – 960 | 45 | 5, 10, 15, 20 | |
| n12 | FDD | 700 | Lower SMH | 699 – 716 | 729 – 746 | 30 | 5, 10, 15 | |
| n14 | FDD | 700 | Upper SMH | 788 – 798 | 758 – 768 | −30 | 5, 10 | |
| n18 | FDD | 850 | Lower 800 (Japan) | 815 – 830 | 860 – 875 | 45 | 5, 10, 15 | |
| n20 | FDD | 800 | Digital Dividend (EU) | 832 – 862 | 791 – 821 | −41 | 5, 10, 15, 20 | |
| n25 | FDD | 1900 | Extended PCS | 1850 – 1915 | 1930 – 1995 | 80 | 5, 10, 15, 20 | |
| n28 | FDD | 700 | APT | 703 – 748 | 758 – 803 | 55 | 5, 10, 15, 20 | |
| n29 | SDL | 700 | Lower SMH | N/A | 717 – 728 | N/A | 5, 10 | |
| n30 | FDD | 2300 | WCS | 2305 – 2315 | 2350 – 2360 | 45 | 5, 10 | |
| n34 | TDD | 2100 | IMT | 2010 – 2025 | N/A | 5, 10, 15 | ||
| n38 | TDD | 2600 | IMT‑E | 2570 – 2620 | N/A | 5, 10, 15, 20 | ||
| n39 | TDD | 1900 | DCS–IMT Gap | 1880 – 1920 | N/A | 5, 10, 15, 20, 25, 30, 40 | ||
| n40 | TDD | 2300 | S-Band | 2300 – 2400 | N/A | 5, 10, 15, 20, 25, 30, 40, 50, 60, 80 | ||
| n41 | TDD | 2500 | BRS | n90 | 2496 – 2690 | N/A | 10, 15, 20, 30, 40, 50, 60, 80, 90, 100 | |
| n48 | TDD | 3500 | CBRS (US) | 3550 – 3700 | N/A | 5, 10, 15, 20, 40, 50, 60, 80, 90, 100 | ||
| n50 | TDD | 1500 | L‑Band | 1432 – 1517 | N/A | 5, 10, 15, 20, 30, 40, 50, 60, 80 | ||
| n51 | TDD | 1500 | L‑Band Extension | 1427 – 1432 | N/A | 5 | ||
| n65 | FDD | 2100 | Extended IMT | 1920 – 2010 | 2110 – 2200 | 190 | 5, 10, 15, 20 | |
| n66 | FDD | 1700 | Extended AWS | 1710 – 1780 | 2110 – 2200[6] | 400 | 5, 10, 15, 20, 40 | |
| n70 | FDD | 2000 | AWS‑4 | 1695 – 1710 | 1995 – 2020 | 300 | 5, 10, 15, 20, 25 | |
| n71 | FDD | 600 | Digital Dividend (US) | 663 – 698 | 617 – 652 | −46 | 5, 10, 15, 20 | |
| n74 | FDD | 1500 | Lower L‑Band (Japan) | 1427 – 1470 | 1475 – 1518 | 48 | 5, 10, 15, 20 | |
| n75 | SDL | 1500 | L‑Band | N/A | 1432 – 1517 | N/A | 5, 10, 15, 20 | |
| n76 | SDL | 1500 | Extended L‑Band | N/A | 1427 – 1432 | N/A | 5 | |
| n77 | TDD | 3700 | C-Band | 3300 – 4200 | N/A | 10, 15, 20, 40, 50, 60, 80, 90, 100 | ||
| n78 | TDD | 3500 | C-Band | n77 | 3300 – 3800 | N/A | 10, 15, 20, 40, 50, 60, 80, 90, 100 | |
| n79 | TDD | 4700 | C-Band | 4400 – 5000 | N/A | 40, 50, 60, 80, 100 | ||
| n80 | SUL | 1800 | DCS | 1710 – 1785 | N/A | N/A | 5, 10, 15, 20, 25, 30 | |
| n81 | SUL | 900 | Extended GSM | 880 – 915 | N/A | N/A | 5, 10, 15, 20 | |
| n82 | SUL | 800 | Digital Dividend (EU) | 832 – 862 | N/A | N/A | 5, 10, 15, 20 | |
| n83 | SUL | 700 | APT | 703 – 748 | N/A | N/A | 5, 10, 15, 20 | |
| n84 | SUL | 2100 | IMT | 1920 – 1980 | N/A | N/A | 5, 10, 15, 20 | |
| n86 | SUL | 1700 | Extended AWS[A 15] | 1710 – 1780 | N/A | N/A | 5, 10, 15, 20, 40 | |
| n89 | SUL | 850 | CLR | 824 – 849 | N/A | N/A | 5, 10, 15, 20 | |
| n90 | TDD | 2500 | BRS | 2496 – 2690 | N/A | 10, 15, 20, 30, 40, 50, 60, 80, 90, 100 | ||
| Band | Duplex mode |
ƒ (MHz) | Common name | Subset of band | Uplink (MHz) | Downlink (MHz) | Duplex spacing (MHz) | Channel bandwidth (MHz) |
This chart is courtesty of CableFree.net. Similar information can also be found at beebom.com, and I’ll throw the FCC’s page on 5G up for reference, as well.
Before we dig into what those numbers mean, we need some more information for reference, which is upon what frequencies these problematic altimeters are based. According to the FCC document cited above, 4.2-4.4 GHz is reserved for aircraft altimeters and similar devices. In the same document, it states that spectrum will be allocated for 5G purposes only up to 3.98 GHz, leaving a 220 MHz buffer.
If you haven’t worked in radio communications very much, these numbers might seem a little dizzying to you, especially the possibly gratuitous chart I decided to include. Let’s focus in on the 220 MHz buffer – just how “big” is that, really? Would there be bleedover and interference concerns?
To grasp this concept, we need a frame of reference. We have a pretty good idea of what a reasonable physical buffer is in various circumstances (although, to reference another current event, Russia appears to think that it needs all of Europe and the Atlantic Ocean as a physical buffer zone with the US), but there is no such intuitive understanding for the electromagnetic spectrum. On one of my satellite projects, I was able to work directly on both the spacecraft and the ground station infrastructure. As a result of this arrangement the antennae were right above us on the roof, and we had multiple oscilliscopes and other tools in the ground station – I’ve since always found it odd that other setups don’t have the oscilliscope view available, or even more basic readouts of signal properties.
Anyway, whenever we would have to reboot the system, the older oscilliscopes would need to be reset (the newer ones were software based visualizations that drew data from the radio bridge and therefore adjusted their displays and settings automatically). This is an illustrative process, because when the reset occurs, the screen returns to a default, zoomed out setting that visualizes a broad swath of the spectrum – say, a whole gigahertz. At this level, the spectrum just looks like a slightly wiggly line (for technical readers, we’re naturally viewing in the frequency domain, not the time domain, and you’ll note that the reason that the line looks only slightly squiggly because in order for that amount of spectrum to be displayed we are no longer able to distinguish any by the very largest of noise spikes).
Since we knew at what frequency we were supposed to be transmitting, we would center upon that frequency, and then we would zoom down to, say, 100 MHz. There is a little more detail visible now, but not all that much. It really all depends on the amplitude of any noise sources in that part of the spectrum that we happen to be observing. We would repeat the process until we could see our own, small signal as a distinctive spike from the surrounding noisefloor.
Now, let’s look at some images. I found these from MathWorks, and have attempted to demonstrate restraint, as a I recognize that most of you will not find staring at spectrum analyzers as interesting as I do.
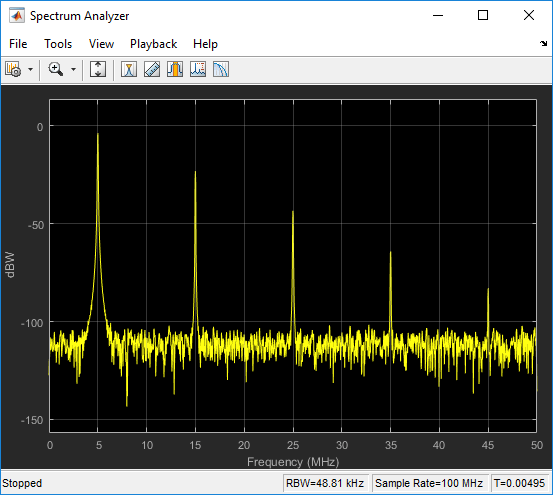
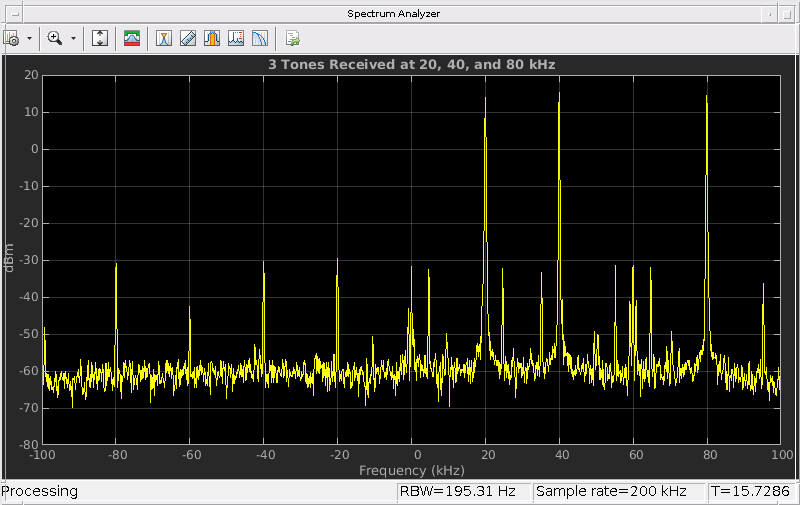
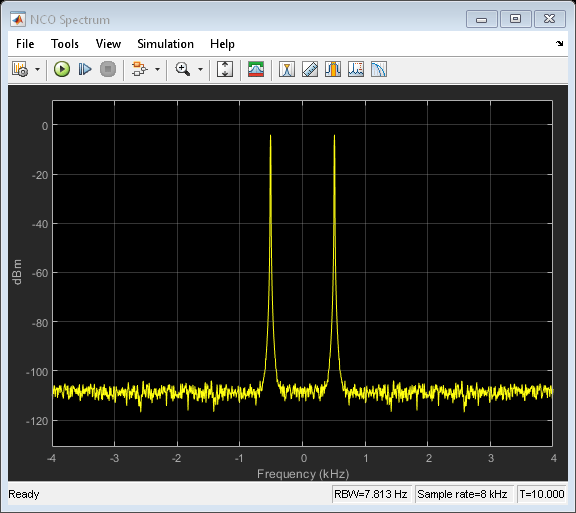
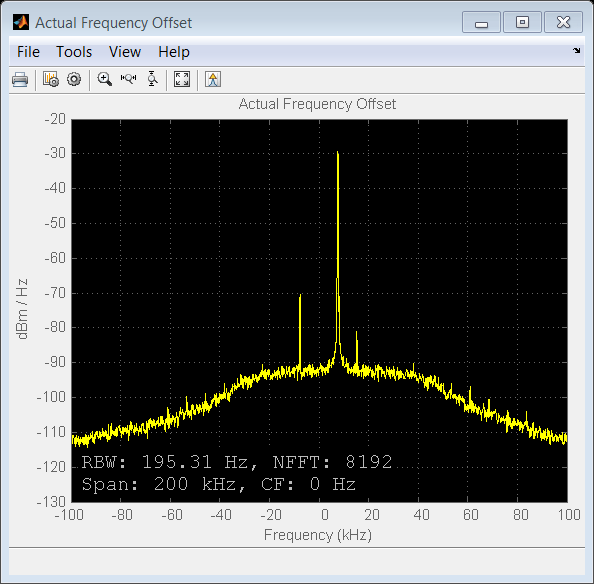
In the upper left, we are looking at just 50 MHz of spectrum, and we can clearly see five distinct signals. It is also possible that there are more hidden in the noise floor that would be revealed at a greater magnification. The image in the upper right is showing just 140 KHz, and we can distinguish twelve major spikes that are probably signals, plus a few other that may or may not be real signals (again, further magnification would be required). At bottom left, we have a range of only 8 KHz, and you can see that in this view the noise is much reduced, and we are able to see two distinct spikes just a single kilohertz apart from each other. The final image has a 200 KHz range, but I included it because it is a little more interesting than the otheres in that it features what appears to be an underlying signal with possibly three other signals punching through it.
Breaking all of this down, radio communication, by which I mean here any and all communication occurring via the electromagnetic spectrum, is based around precision. In frequency modulation, should you zoom in far enough with one of these tools you would be able to see a spike like the ones pictured above jumping back and forth between different frequencies. Yes, amplitude matters, and significantly high amplitude at one set of frequencies can mess with the noise floor at adjacent frequencies, but that effect is typically minimal, for a very good reason – it’s an inefficiency that is designed against. Energy that goes into raising the noise floor at another part of the spectrum is energy that is not going into communicating information as intended.
With all of this in mind, it is my opinion that a 220 MHz buffer is probably more than sufficient to safeguard aviation uses from interference as a result of 5G C-band utilization, even accounting for potential edge cases. While this is based on general knowledge of the subject, and not on any specific studies or analyses that I personally conducted, it does appear to be supported by research conducted by the FCC, and previously approved by the very FAA that is now demanding more.
Like I said, I can’t answer how this is going to work out in the end. There is far too much politicking going on for that, and the inner workings of government bureaucracies are far, far more complicated and difficult to understand than the most opaque aspects of the disc-embedding theorem. However, I do hope that I was able to shed some light (all puns intended) on the subject, and maybe answer some of your questions, asked or otherwise, about what is really going on with this 5G rollout. Don’t worry: we’ll be back to our normal programming next week.
In the meantime, if you do have any questions left unanswered by this article, or if you would like me to go into more detail or explain in a different way something that was covered, please post in the comments below.

2 thoughts on “A Few Thoughts on the US 5G Standoff”